web
You’re offline. This is a read only version of the page.
close
Skip to main content

Announcements

News and Announcements icon
Community site session details

Community site session details

Session Id :
Power Platform Community / Forums / Copilot Studio / Best Approach to Centr...
Copilot Studio
Suggested Answer

Best Approach to Centralize AI Adoption and Usage KPIs Across an Organization

(1) ShareShare
ReportReport
Posted on by 101

Hello Team,

We have an admin team that tracks AI rollout KPIs across our organization. Their goal is to understand how effectively AI is being adopted and used across the organization, including AI licenses, Copilot usage, agents, and other AI-related services.

Currently, the team manually exports reports from different platforms, such as Microsoft 365 Admin Center, Viva Insights, and Azure, and then combines the data to prepare a final KPI spreadsheet.
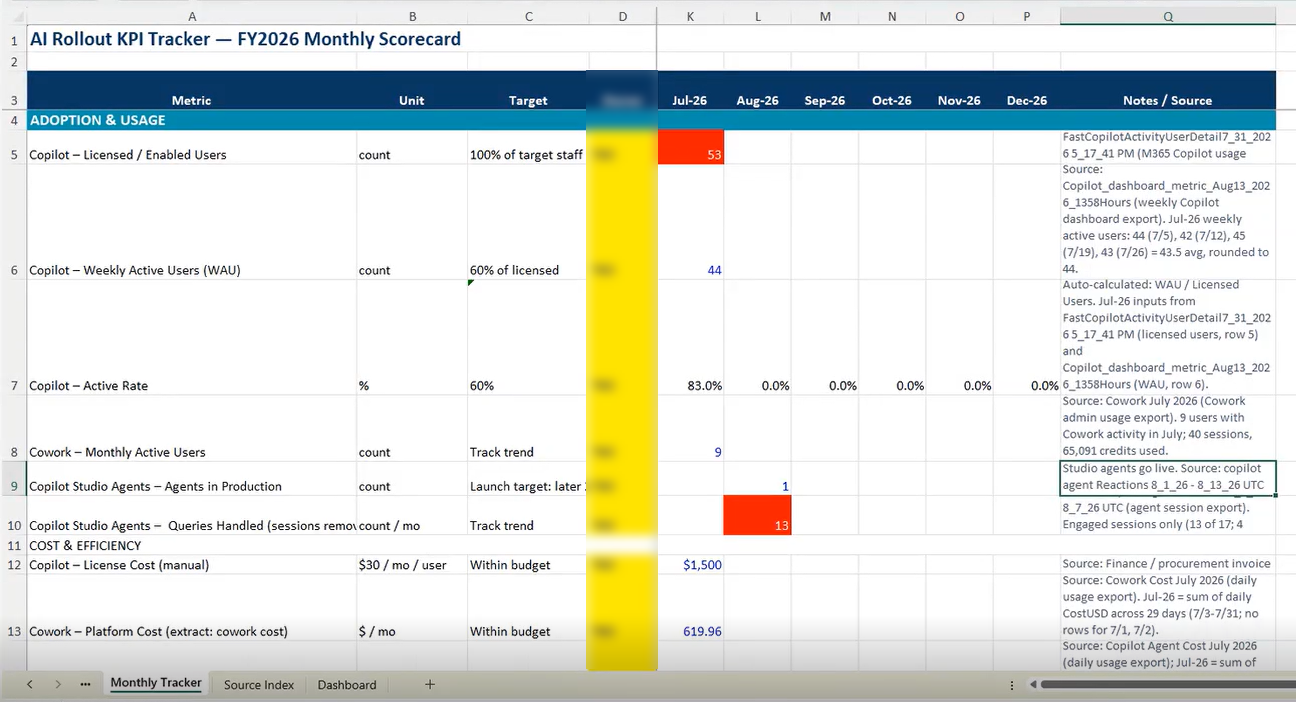
We are looking for a better and more automated approach to monitor and track the overall AI rollout, adoption, and usage across the organization.

For example:

  • Is there a Microsoft-supported solution or dashboard that can provide a centralized view of AI adoption and usage?
  • Can data from Microsoft 365, Viva Insights, Azure, Copilot, and Copilot Studio agents be consolidated into a single dashboard?
  • Is there an API, connector, or reporting capability that can be used to automate the collection of these KPIs?
  • Would Power BI, Microsoft Fabric, Microsoft Graph, or another Microsoft service be a suitable approach for building a centralized AI KPI dashboard?
  • What metrics would you recommend tracking to measure the overall success of an organization's AI rollout?

If anyone has implemented a similar AI adoption/KPI monitoring solution, I would appreciate any recommendations, architecture suggestions, or references to Microsoft documentation.

  • Sam_Fawzi Profile Picture
    1,150 Super User 2026 Season 1 on at
     
    Before building anything, check what you are already entitled to. Copilot Analytics covers most of this and your team may be paying for it already.
     
    Copilot Analytics spans the readiness and adoption report in the M365 admin center, the Copilot Dashboard, an Agent Dashboard, a Consumption Dashboard, and Advanced Reporting with pre-configured Power BI dashboards in Viva Insights. Rolling out August into September 2026, eligible Viva Insights users can now create, customize, and save supported Power BI reports, including a Microsoft 365 Copilot Adoption report and a Copilot Studio Agents report. That last one is close to what you are assembling by hand.
    Note this is not a new SKU. Anyone with a Copilot license is automatically assigned a Viva Insights service plan and is in the measured population. Access to the new reporting is tied to eligible Viva Insights roles rather than blanket licensing, so scope it to the few people who actually need it rather than assigning across the org.
     
    Two smaller wins:
    • The Analytics Viewer role in Copilot Studio is GA. It grants access to a specific agent's Analytics page, so your admins can read agent metrics without becoming agent owners or environment admins.
    • High-usage users in the admin center surfaces individuals driving consumption on pay-as-you-go Copilot services, which is your cost-driver and license-optimization view.
    Then fill the gaps
    • Agent inventory. The Agent Registry in the M365 admin center needs no license, only the AI Reader role. There are also Graph GET packages APIs for reporting. Use this instead of maintaining a list by hand.

    • Per-user Copilot detail. Graph, /copilot/reports/getMicrosoft365CopilotUsageUserDetail(period, version), with Reports.Read.All. Pass version=2  for prompts submitted and active usage days. Licensed users only, and unlicensed Copilot Chat usage is not in Graph at all, so pull that from the Copilot Chat usage report or the Purview audit log.

    • Azure AI spend. Azure Cost Management. Nothing above covers it.
     
    Two things to plan for

    Graph caps at 180 days and Copilot Studio session analytics retention is shorter. Snapshot monthly into Dataverse or a lakehouse or you will not have a trend line when leadership asks for one.

    And definitions do not reconcile across sources. An active user in the Copilot dashboard is not an engaged session in Copilot Studio, and neither is a licensed seat. Record the source next to every metric. I keep a source index beside my tracker for this, and it is the difference between reviews about what the numbers mean and reviews about which number is right.


    some references:

    Copilot Analytics

    https://learn.microsoft.com/en-us/viva/insights/copilot-analytics-introduction

    https://learn.microsoft.com/en-us/viva/insights/org-team-insights/copilot-dashboard


    Graph Copilot usage reports


    Copilot Chat usage report (the unlicensed gap)

    https://learn.microsoft.com/en-us/microsoft-365/admin/activity-reports/microsoft-copilot-usage?view=o365-worldwide

    Agent Registry


    Agent management in the admin center
    https://learn.microsoft.com/en-us/microsoft-365/admin/manage/manage-copilot-agents-integrated-apps?view=o365-worldwide
  • Suggested answer
    Valantis Profile Picture
    7,545 Super User 2026 Season 2 on at
     
    one specific tool worth bolting onto that architecture for the Copilot Studio side. Microsoft's Power CAT team publishes a free, open source add on called Copilot Studio Kit. It gives you Conversation KPIs stored in Dataverse, sessions, turns, resolved vs escalated vs abandoned, plus custom KPIs like NPS, sample Power BI reports built on top of that data, an Agent Inventory page for tenant wide visibility into every Copilot Studio agent, and an Agent Value dashboard for classifying agents and measuring what they're actually delivering.

    Useful specifically because Copilot Studio's own native analytics window is 30 days.
    The Kit's Conversation KPIs get retained as long as you configure, so it solves the same trend line problem Sam already flagged for Graph's 180 day cap, just on the Copilot Studio agent side. It's on GitHub under microsoft/Power-CAT-Copilot-Studio-Kit if you want to look before deciding whether to build something custom.
     
      Best regards,

    Valantis   ✅ If this helped solve your issue, please Accept as Solution so others can find it quickly.

    ❤️ If it didn’t fully solve it but was still useful, please click “Yes” on “Was this reply helpful?” or leave a Like :).

    🏷️ For follow-ups  @Valantis.

    📝 https://valantisond365.com/ 💼 LinkedIn   ▶️ YouTube
  • Valantis Profile Picture
    7,545 Super User 2026 Season 2 on at
     

    Just wanted to check in and see if everything is working now. If you still need any help, feel free to let me know.

    Also, if the issue is resolved, it would be great if you could mark the answer as solved so others with the same question can find it easily.


    Thanks and have a great day!

Under review

Thank you for your reply! To ensure a great experience for everyone, your content is awaiting approval by our Community Managers. Please check back later.

Helpful resources

Quick Links

Season of Sharing Community Challenge Winners!

Congratulations to our community stars!

Kudos to our 2025 Community Spotlight Honorees

Expanding mentorship, skilling, and AI innovation

Leaderboard > Copilot Studio

#1
Mohsin Ali Profile Picture

Mohsin Ali 360

#2
Valantis Profile Picture

Valantis 253 Super User 2026 Season 2

#3
11manish Profile Picture

11manish 184 Super User 2026 Season 2

Last 30 days Overall leaderboard
