


 Share
Share Report
 10
10Hello!
I am currently building a canvas App where, in the main screen, projects are listed and their details can be seen as well
This app works using a Sharepoint List as data source.
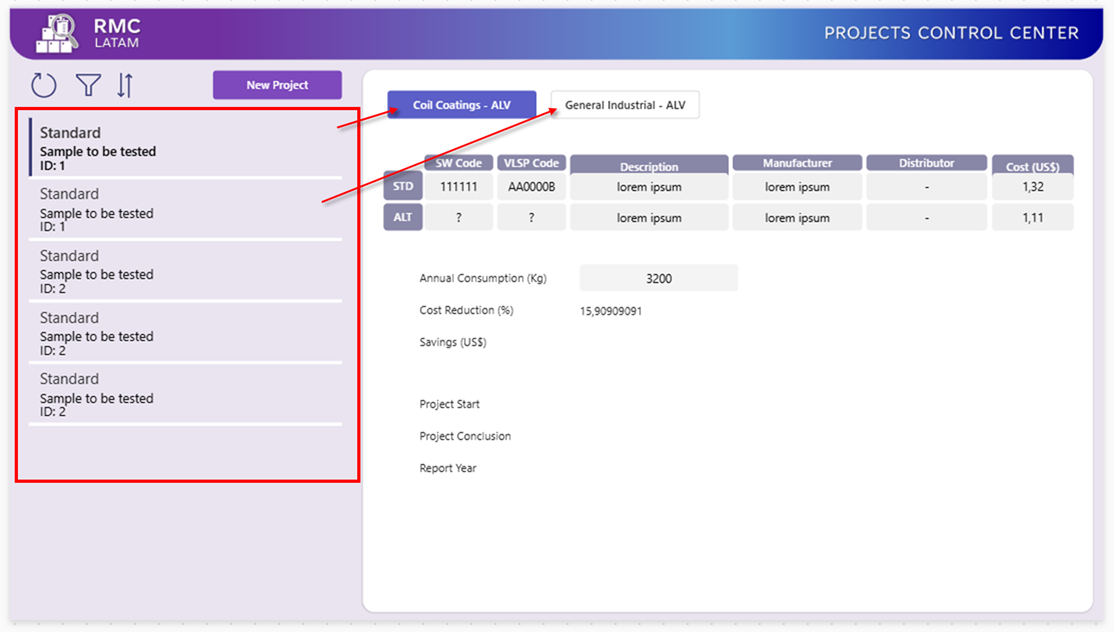
For you to understand it better, here is how it looks, so far:
I am currently building a canvas App where, in the main screen, projects are listed and their details can be seen as well
This app works using a Sharepoint List as data source.
For you to understand it better, here is how it looks, so far:
The gallery marked in red is where all the projects will be listed, by name and their details shall be seen in the container on the right.
My first problem: For each single project, several business units (BU) might be performing their own evaluations, and I need to track them individually.
I intend to do that by creating new rows for each BU and identify that they are all from the same project by creating a common project ID (just like you may see in the print as "ID: X")
To make visualization easier, I want the gallery to group projects under the same ID and only display each ID once. When a project is selected, a second smaller gallery will display buttons where you can select the different BUs to see the details for them (so basically, big gallery: selection of a group of rows, small gallery: selection of rows individually).
Right now, without filtering, all the rows are appearing in the project gallery, so we see "duplicates" on the list. (you can see 2 lines with ID:1 and 3 with ID:2).
They are also appearing on the smaller gallery (Indicated by the arrows).
Using the GroupBy function, I can easily solve this situation:
But then, comes my second problem: Complex filtering!
There are some filters I need to apply, and they need to evaluate each row individually, independent of the grouping. For example
Let's say I have two projects
PROJECT A
BU: Coil
BU: GI
PROJECT B
BU: PKG
BU: GI
If I select the BU filter for "GI", A and B project groups should pop up as a result, since both have rows with "GI" as BU
If I select "Coil", only Project A group should pop up, and so on.
Here are all the filters I will be applying:

I am trying to figure out a way to apply the filter function within the GroupBy, but the columns combined by this function are not showing up in the filter formula.
Distinct only brings up the ID column, so I understand I can't use it in this situation.
Anyone has an idea of how this can be coded?
Sorry if the explanation is too confusing.
There are some filters I need to apply, and they need to evaluate each row individually, independent of the grouping. For example
Let's say I have two projects
PROJECT A
BU: Coil
BU: GI
PROJECT B
BU: PKG
BU: GI
If I select the BU filter for "GI", A and B project groups should pop up as a result, since both have rows with "GI" as BU
If I select "Coil", only Project A group should pop up, and so on.
Here are all the filters I will be applying:
I am trying to figure out a way to apply the filter function within the GroupBy, but the columns combined by this function are not showing up in the filter formula.
Distinct only brings up the ID column, so I understand I can't use it in this situation.
Anyone has an idea of how this can be coded?
Sorry if the explanation is too confusing.
Categories:
I have the same question (0)
 All responses (
 Answers (


